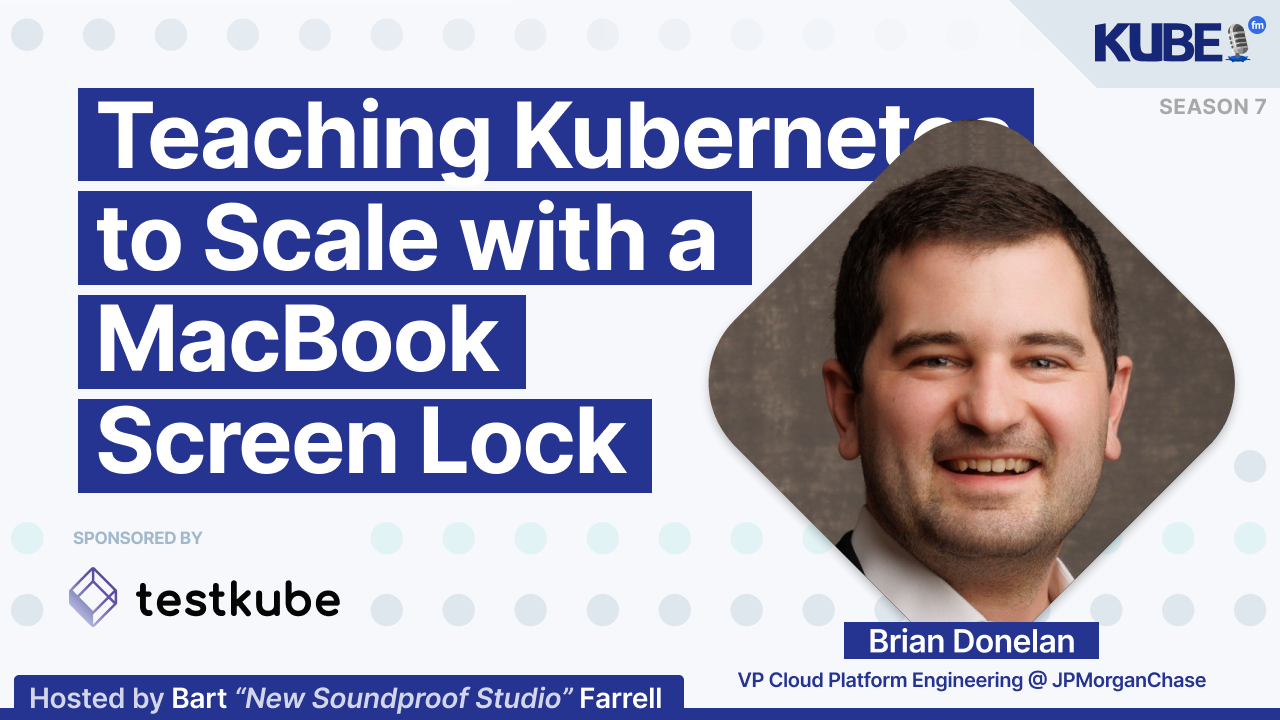
Bart: In this episode of KubeFM, I'm joined by Brian Donelan, lead software engineer at JPMorgan Chase. We dive into a side project he wrote about KEDA and Karpenter to teach Kubernetes to autoscale based on whether his MacBook is open or closed. By wiring screen lock events into CloudWatch, KEDA, and Karpenter, Brian built a system that cuts costs by scaling pods and nodes all the way down when he's not using them.
What starts as a clever hack for saving money becomes a bigger conversation about event-driven elasticity, sustainability, and how developers can rethink the signals they use to scale workloads. Brian also shares how this approach could extend beyond personal projects into financial services, e-commerce, and other industries where leading indicators can make all the difference.
We're excited to partner with TestKube for today's episode. Testing applications in Kubernetes doesn't have to be complicated or slow. TestKube is your go-to platform for cloud-native continuous testing. With TestKube, you can effortlessly orchestrate, scale, and automate tests right within Kubernetes, catching issues early and deploying with confidence. Try it out today and see why engineering teams trust TestKube to keep their testing simple and scalable. Visit testcube.io to get started.
Now, let's get into the episode. Brian, welcome to KubeFM. What are three emerging Kubernetes tools that you are keeping an eye on?
Brian: Thanks, Bart. First and foremost, I like to follow the Cloud Native Computing Foundation projects. Three that I'm presently interested in are: first, Keptn. I know many people spend significant time and effort on their release trains. Keptn seems like a good solution that could help with deployment observability, evaluations, and tasks. Second, the Operator Framework. As you know, operators are an extension point into Kubernetes that allow you to write custom code to manage custom resources. Earlier this year, I was writing an operator for work to manage some aspects of a vendor product we run, and I found it fascinating. Third, Cilium and the eBPF stack. In the past at work, we used Calico as our container networking interface in Kubernetes, but we're looking at switching to Cilium soon. Cilium offers lower latency by bypassing IP tables in favor of extended Berkeley Packet Filter and security benefits enabled by eBPF.
Bart: So, for folks who don't know you, Brian, can you tell us what you do and who you work for?
Brian: Sure, Bart. My story begins when I was three years old and I started with an extension cord for my birthday. I wanted to use the extension cord to figure out how the vacuum cleaner worked because I was afraid of the loud noise it made, but so curious about the device. My parents knew from a young age that I was a bit of a dork. By the time I was in second grade, I was getting QBasic programming books from the library and reading PC World magazine cover to cover.
Today, I work for JPMorgan Chase as a lead software engineer in the global banking platform. For probably the last 60 years, the bank has hosted most of the ledgers that serve as the core of the bank on mainframe hardware. We're working on rewriting these legacy applications to be cloud native, running on Kubernetes and AWS.
Bart: How did you get into cloud native?
Brian: In 2017, I took an Udemy course on Kubernetes. At the time, I had just transitioned from a Java development role into a DevOps role, following a mentor of mine. The course on Kubernetes really captivated my attention, and I started playing with Minikube quite a bit.
The team I was on became early adopters of Kubernetes in the bank, just as AWS EKS was getting started, back in the Kubernetes v1.9 days. We had an opportunity to evangelize Kubernetes and container-based development throughout the firm, which was really exciting.
The bank was slow to adopt Cloud at that time. Our CEO felt that Cloud was akin to outsourcing IT, which he had seen fail dramatically in the past. He wanted soldiers, not mercenaries, so to speak. I grew frustrated with the slow progression of Cloud, sensing it to be the future, and left to go to the aviation firm NetJets. There, I got to work on a wide variety of AWS technology on cutting-edge applications and attend reInvent for the first time, which I loved.
Bart: What were you before cloud native?
Brian: I studied mechanical engineering at Vanderbilt University for undergrad, but many of my internships had strong elements of software engineering, or at least were strongly IT adjacent. I quickly realized I liked software better than mechanical engineering, not just because I was happier away from oil rigs or automotive manufacturing lines where many of my classmates would begin careers. I found that with software, you could rapidly develop new solutions and see them take on a life of their own, while mechanical engineering had a longer time horizon. I finished my degree but began aiming towards software. Once there, I did a mix of development, mostly in Python, JavaScript, and Java, and SysOps work, learning my way around the Linux command line. These skills were invaluable for my future career, but the mechanical engineering problem-solving mindset—the ability to deconstruct a system into its component parts and reason about them—continues to serve me today.
Bart: Now, the Kubernetes ecosystem and the cloud native ecosystem move very quickly. How do you stay updated? What resources do you use to know what's going on?
Brian: I think work is one resource. We have a central technology organization in the bank which is constantly publicizing new technologies available for consumption. In addition to conversations and knowledge sharing with coworkers, the official Kubernetes blog is another great resource. For instance, I was recently reading about the Gateway API inference extension for routing inference traffic to large language model pods. The explanations were great, and the diagrams succinctly gave me a grasp of the concept. Another resource is the CodeReport YouTube series by Fireship. I find these videos quite entertaining and informative about the latest developments in technology.
Bart: If you could go back in time and share one career tip with your younger self, what would it be?
Brian: It would be beneficial to spend more time on side projects. Side projects are a great resource because you can pick applications of technology that are very interesting to you and see where they take you.
Bart: The provided transcript snippet is incomplete and does not provide enough context to apply hyperlinks. Could you provide the full transcript or more context about the content?
Brian: I was working on a side project this spring and needed to run a handful of web services. These services I would normally have run directly on my MacBook, but they were too resource-intensive for my hardware. The easiest solution was to run them in the cloud. That would, of course, entail hourly costs, which I was eager to minimize.
I thought, "These services are just an extension of my MacBook. No one else will use them." So I wanted to find an automated way to turn them off when I close my laptop so I don't forget, leave them running, and rack up a larger than necessary bill. I think it's a problem that almost anyone who uses the cloud can relate to.
In fact, there's a joke: A software engineer rubs a lamp and a genie appears. The genie says he'll grant the engineer a billion dollars, but only if they can spend a hundred million in a single month with three rules. You can't gift it away, you can't gamble with it, and you can't throw it away. The software engineer responds, "Well, can I use the cloud?" And the genie responds, "Okay, there are four rules."
In my professional work, this has certainly been borne out too. We were working on a greenfield application moving fast, and the initial sizing of, for example, our managed streaming Kafka cluster was done based on an engineering assumption. Now Kafka broker sizing is driven predominantly by the network traffic throughput at the brokers. Once the cluster is built and serving production-level loads for a while, you can look at the data and see if you're oversized.
When I got time to write a script to scrape actual CloudWatch metrics for that network throughput from two dozen AWS accounts, I found we were overpaying by half a million dollars each year, spread across the two dozen environments. The lesson to me is that it takes equal parts discipline and automation to keep cloud bills in check.
Bart: In your article, you mention Werner Vogels' frugal architect keynote and the concept of elasticity in cloud computing. How does your screen lock solution embody those principles?
Brian: Traditionally, Kubernetes has scaled pods with horizontal pod autoscaler (HPA). HPA is driven by metrics like CPU and memory consumption of pods. There are two problems with this approach. First, these metrics aren't always the best proxies for demand. I've seen event-driven workloads where the bottleneck is the network card, not the CPU or RAM. Second, these metrics and HPA react more slowly than event-based triggers like incoming HTTP requests.
Because of this, AWS Lambda, the function-as-a-service offering where you bring your code and the cloud provider brings all the infrastructure needed to run it, has been viewed by some as more elastic than Kubernetes. Lambda can spin up a new instance in milliseconds to seconds. Kubernetes, on the other hand, needs to first schedule the container, wait for the container image to pull, wait for startup scripts and probes to clear, and possibly even provision a whole new node if no existing capacity is available.
My screen lock solution embodies the principle of elasticity because it allows me to scale apps up and down based on a leading indicator of whether I might want to use the apps: a metric indicating whether my laptop is closed or not.
This brings us to the frugal architect. Vogels lays down a series of laws for building cost-aware, sustainable architectures. His third law is that architecting is a series of trade-offs. He says cost, resilience, and performance are non-functional requirements that are often in tension with each other. I firmly believe and agree with these principles.
That said, I believe the screen lock solution fits neatly into a niche space. The apps I'm hosting are only for my consumption, so scaling them down when I'm away from my laptop doesn't cause service degradation. It doesn't represent a trade-off by virtue of how unique the problem is.
If I were serving tens or hundreds of users, I might look for other leading indicators of demand, as opposed to the lagging indicators like CPU or memory. I might even run a time series forecasting ML algorithm based on historical data as a first pass for scaling decisions.
Bart: Now let's dive into your ingenious architecture: How does a MacBook screen lock event actually trigger Kubernetes pods to scale down?
Brian: It all starts with the macOS daemon, a background process that runs continuously on the developer's laptop. As long as the laptop has an internet connection, it uses the AWS software development kit for Swift to make API calls to put metric data for CloudWatch. This creates a boolean value: zero for locked, one for unlocked, and no value if there's no internet on the development machine. The process stores the time series of the development workstation's state in the cloud.
Once this time series data is in the cloud, we can access it from anywhere, including from our Kubernetes cluster. The Kubernetes event-driven autoscaler (KEDA) will pull or query every 60 seconds to check the current value. In our KEDA scaled object manifest, we define the properties for how we want our deployments to scale based on the events KEDA observes.
Here we set minReplicaCount to 0 and maxReplicaCount to 1, so KEDA will scale our deployment up when the boolean value is 1 (unlocked) and down when the value is zero (locked) or when there's no data due to no internet on the development box.
But how does Kubernetes know to scale the nodes when we scale down the pods? That's where Karpenter comes in. We get Karpenter automatically by selecting EKS Auto Mode, where AWS provides Karpenter as a service. Karpenter is a just-in-time autoscaler for Kubernetes nodes and comes with a feature called consolidation, where underutilized nodes are purged once a properly sized replacement node is brought online, if applicable.
The whole flow is: the macOS daemon sends metrics to CloudWatch. KEDA checks CloudWatch once a minute and scales the pods appropriately, which by virtue of Karpenter then auto-scales the nodes in the cluster. This ensures we only pay for the compute we are actively using and need.
Bart: Your macOS implementation uses Swift and Apple's Distributed Notification Center to detect screen lock events.
Brian: The app defines two possible states: locked and unlocked. It creates a listener that waits for specific notifications from macOS Distributed Notification Center, setting up two observers that watch for two specific events: when the screen gets locked (such as when you step away and it automatically locks) and when the screen gets unlocked (when you come back and enter your password).
The app reads from a config.json file key details like the AWS access key to connect to CloudWatch, the metric namespace and name, and how often to send metrics to AWS. Every configurable unit of time (defaulting to 60 seconds), the app ships the current state of the screen lock to CloudWatch.
One other configurable parameter in config.json is the machine name. This is configured as a dimension on the metric, which means we can easily aggregate across different machine names, such as the maximum value across the dimension. This would indicate whether any of n machines are unlocked, which could be useful if you own multiple development machines or have multiple developers, each with their own machine.
Bart: Now, KEDA, or Kubernetes Event-Driven Autoscaler, is central to your solution. For those unfamiliar with KEDA, a CNCF project, what makes it special compared to traditional Kubernetes horizontal pod autoscaler?
Brian: KEDA differs significantly from traditional Kubernetes autoscaling mechanisms in several key ways. First, there's event-driven versus resource-based scaling. Traditional Kubernetes horizontal pod autoscaler scales based on resource metrics like CPU and memory usage. However, KEDA scales based on external events and metrics from various sources like message queues, databases, monitoring systems, and custom metrics. This makes it ideal for event-driven workloads where CPU and memory usage do not correlate well with actual demand.
The second way it differs is scale-to-zero capability. One of KEDA's most distinctive features is its ability to scale deployments down to zero replicas when there's no workload to be done. Traditional HPA can only scale down to a minimum of one replica. This zero scaling capability is particularly valuable for batch processing jobs, event-driven microservices, cost optimization, development environments, and serverless-style workloads on Kubernetes.
Finally, the third way it differs is the extensive scaler ecosystem. KEDA provides more than 60 built-in scalers for popular technologies, including message queues like RabbitMQ and Apache Kafka, Amazon SQS, databases like PostgreSQL and MySQL and Redis, cloud services like AWS CloudWatch and Azure Monitor, GCP Pub/Sub, and monitoring systems like Prometheus, Datadog, and New Relic. This really eliminates the need to build custom metric adapters for complex integrations.
Bart: Now, you mentioned some authentication challenges with KEDA and AWS. What issues did you encounter, and how did you solve them?
Brian: KEDA has to authenticate to AWS to get access to CloudWatch. The best authentication pattern is using the pod's own identity, which AWS can provide in two ways: the traditional, legacy method using Kubernetes service account and OIDC-based IAM roles for service accounts, and the
Bart: Now let's talk a little bit more about the CloudWatch integration. How does your custom metric work, and what does it look like in practice?
Brian: I wanted to keep the metric as simple as possible. So I set 0 to locked, 1 to unlocked, and no data essentially meaning locked, because the laptop must be offline. KEDA queries the metric every 60 seconds, but this is configurable in the polling interval field of the KEDA scaled object manifest, which is one of the two types of manifests I had to apply to Kubernetes to get this to work. The example I provided in the article shows the laptop unlocked from 2030 Zulu until about 2100 Zulu, locked from 1800 to 2010 Zulu, and offline from 2010 to 2030 Zulu.
Bart: Your configuration includes an interesting detail about supporting multiple developers. How does the solution scale across a team?
Brian: For scaling across the whole team, I decided to leverage the dimensions attribute of CloudWatch Put Metric Data payload. AWS's CloudWatch Put Metric Data documentation explains that dimensions further clarify what data the metric collects. By adding just one dimension indicating the machine name, we can slice and dice data for a specific machine name or aggregate across multiple machine names. We could readily add additional dimensions to the metric, such as team name or office location.
Bart: From a cost perspective, you estimate 80% savings on compute costs. How did you arrive at this number, and what are the actual infrastructure costs of running the solution?
Brian: Great question. My estimated savings depend entirely on the proportion of time the workloads are scaled up. From this assumption, it follows that we can subtract the percentage of time the laptop is unlocked from 100% to get the proportion of time that workloads are scaled down and thus costs are avoided.
Of course, this assumes that all workloads are scaled down with KEDA. If some workloads were left scaled up, we would need to account for the mix of scaled up and scaled down workloads and their compute sizing separately.
We should also account for the CloudWatch API costs. Per AWS documentation, the GetMetric data API call is charged at a rate of one cent per thousand metrics. Since there are 43,800 minutes in a month, and this configuration fetches the metric once per minute, the configuration would cost about 44 cents per month for each KEDA scaled object in use and fetching CloudWatch metrics.
One of the things I'm most passionate about, which I haven't tried to quantify yet, is the carbon footprint reductions leading to reduced environmental impact.
Bart: As a side note, just yesterday, I interviewed someone from a startup called Compute Gardener, and I'll send over a link later. If you're interested in reduced carbon environmental impact, somebody should definitely check it out. This is clearly a creative use of KEDA that goes beyond its typical use cases. What other unconventional metrics could developers use to trigger auto-scaling?
Brian: In general, I like to think about leading indicators of compute demand with the goal of providing just-in-time compute capacity. It depends on the industry, but in financial services, we could scale on real-time volatility metrics like the VIX fear gauge to right-size trading strategy simulation workloads. In e
Bart: You mentioned this is specifically for non-production workloads accessed via Tailscale VPN. Why is this approach particularly suited for developing environments versus production?
Brian: I mentioned Tailscale to emphasize that this compute does not serve public internet traffic, only private network traffic to my laptop. A metric derived from activity in my private device could offer a representative sample with which to control the available compute. If that were not the case, we might need to look at alternative data sources that would be representative of public behavior, like retail foot traffic or financial services volatility.
Bart: The transcript snippet is incomplete. Could you provide the full context or the rest of the sentence? Without the complete context, I cannot confidently identify terms to hyperlink.
Brian: One of the wonderful things about AWS is they have SDKs for just about every language and platform. Even if that fails, they offer a REST API that you can implement the calls yourself. In this way, I believe this identical service could be built for almost any operating system that supports programmatic notification of the lock screen or user session state.
More broadly, implementing the bare minimum of library dependencies needed to do the job and taking other steps to maximize resource efficiency are key. This includes preventing memory leaks, handling errors appropriately (such as managing connectivity loss), managing secret credentials as securely as possible, and utilizing least privilege when vending out those credentials.
Bart: Your solution uses Karpenter for node autoscaling alongside KEDA for pod autoscaling. How do these two tools work together to maximize cost savings?
Brian: For Karpenter, I used EKS Auto Mode, which I think of as a managed Karpenter cluster. Karpenter is continuously looking at the currently scheduled pods and finding ways to reduce total cost. It actually pings the AWS Cost API to determine which EC2 instances will best minimize your bill. KEDA sits on top of that and scales the pods themselves up or down. Together, these two components create true elasticity at both application and infrastructure levels.
Bart: Looking at the broader implications, this solution challenges how we think about Kubernetes workload management. What lessons can the Kubernetes community learn from this approach?
Brian: It reminds me of an article I had read recently on creativity, which quoted Mark Twain: "Substantially, all ideas are secondhand, consciously and unconsciously drawn from a million outside sources." This combinatorial creativity, as scientists call it, can help you innovate your way around problems.
This project was no different in my view. I had an idea that I could monitor the state of my laptop, similar to how Prometheus Node Exporter monitors the state of a server, and an idea that Kubernetes could autoscale in response to that metric to save cost. The idea was not new per se, but a new combination of different old ideas.
In this way, I'd encourage listeners to question assumptions, think creatively by trying to combine different old ideas in new ways, and consider how that innovation can serve some business or social good. I'd encourage listeners to identify their own patterns of waste and chip away at that—optimize that.
Bart: For developers out there inspired by this idea, you've open-sourced the code on GitHub. What advice would you give to someone wanting to implement something similar?
Brian: Start by understanding your actual usage patterns and the drivers behind those patterns. Identify the signals with predictive value. Can you find the signal or combination of signals that indicates real upcoming compute demand in your context? Don't be afraid to connect seemingly unrelated systems if you can make a coherent argument. Monitor actual savings to validate the approach before broader rollout.
Bart: Now, what's next for you?
Brian: My wife and I are expecting our first child soon, Bart, so I'm fully expecting life to soon get turned upside down in the best of ways. In between changing diapers, I'll be tinkering on Kubernetes or cloud and hopefully connecting with like-minded folks like you and your listeners.
Bart: Fantastic. And for folks out there who would like to get in touch with you, what's the best way to do so?
Brian: LinkedIn is the best way to reach me.
Bart: Thank you so much for joining us today, Brian. Best of luck on your next adventure, and I look forward to hearing more about your side projects in the future. Take care.
Brian: Thank you, Bart.


