Bart Farrell: Who are you? What's your role? And where do you work?
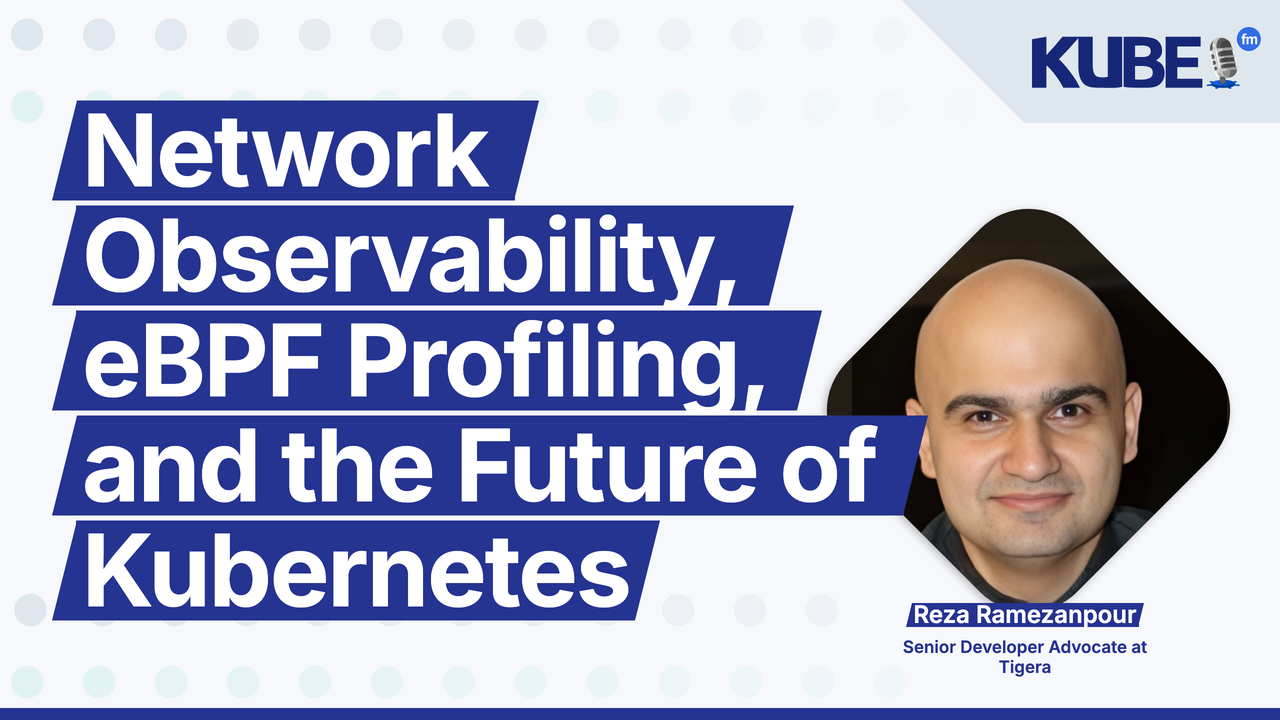
Reza Ramezanpour: Hello, everybody. My name is Reza. I'm a Senior Developer Advocate at Tigera. My role is basically to figure out what's in the tech and try to explain it to others. And as I said, I work in Tigera. So that's about me.
Bart Farrell: What are three Kubernetes emerging tools that you're keeping an eye on?
Reza Ramezanpour: So I need to be on brand here because the first thing is Calico Whisker and staged default policies. Now, you would say, well, here is a Tigera person talking about the stuff that they're doing and drinking their own Kool-Aid. But I will let you know that after introducing staged default policy, even the CNCF community came together and brought some stuff that are sort of close to what we are having. And in Cilium, they added blocks. But anyway, the idea with Whisker and why I'm trying to say it's emerging tool is that instead of giving you observability into networking, we're giving you observability into networking and leading it with network policies. So you get a hierarchical vision of what is going on in your cluster. And these are all open source and free. So basically, you can create a policy, figure out what the policy is doing and figure out how the performance is actually for each policy that you wrote. The other tools that I've been trying to figure out what they're doing, and I'm very excited to see them, one of them is K Gateway. It's sort of a gateway API implementation, which is sort of unique because it's backed by CNCF. A lot of projects are backed by CNCF, but this one in particular. It's sort of like the go-to for CNCF and they're trying to make it as successful as possible. So keep your eye on that. And last one, it's a personal thing that I have found. I come from a VM sort of background when I used to do computer stuff, used to be bare metals, then VMs. And I got very involved into not having your operating system installed on your disk drives. So with that introduction, I think you know what I'm going to talk about. It's Talos Linux. It's one of those things that I feel like it's a great sort of like technology. And I believe everybody that works with these sort of things that are immutable will find them very interesting because it takes a lot of disadvantages off of the table. For instance, viruses, ransomwares, those sort of things. So observability, Ingress or Gateway API, and immutable OS. These are the things that I think require an eye to be kept on.
Bart Farrell: When asked about networking being the least favorite Kubernetes feature, our guest Amos said, I've destroyed two clusters that way. Have you had similar challenges with Kubernetes networking?
Reza Ramezanpour: Yes and no. So I need to elaborate on this. Again, I've been working with computers and networking for half of my life, I guess. But the idea is fundamentals are very important. While we are using Kubernetes, it is very important to note everything is still on the OSI model from layer one to layer seven. There are some abstractions. We're taking out, for instance, MAC addresses for Project Calico because it's a pure layer three sort of routing. But the most important thing is you cannot get rid of the fundamentals. So did I break any Kubernetes cluster because of networking? Yes. What did I do? I was trying to do something that the underlying networking doesn't allow me to do. It doesn't permit me to do. So it is very important to know if you are on a cloud network, what sort of encapsulation you're using, what sort of CNI you're using, is that encapsulation allowed or permitted on that networking layer. Again, everything that you do in a cloud provider is not magical. It's, again, computers that are running somewhere who just renting them. So you need to be mindful of what is actually permitted there. For instance, on Azure, you cannot use IPIP, but on AWS you can use it. There are advantages, disadvantages on each technology, networking technology that you can use. So my challenging experience was figuring out one of the configurations that I had, which was AWS and IPIP, doesn't work on Azure with IPIP. And why did I arrive at it? It was because... I sort of assumed because it's working on one place, it should work on the other place.
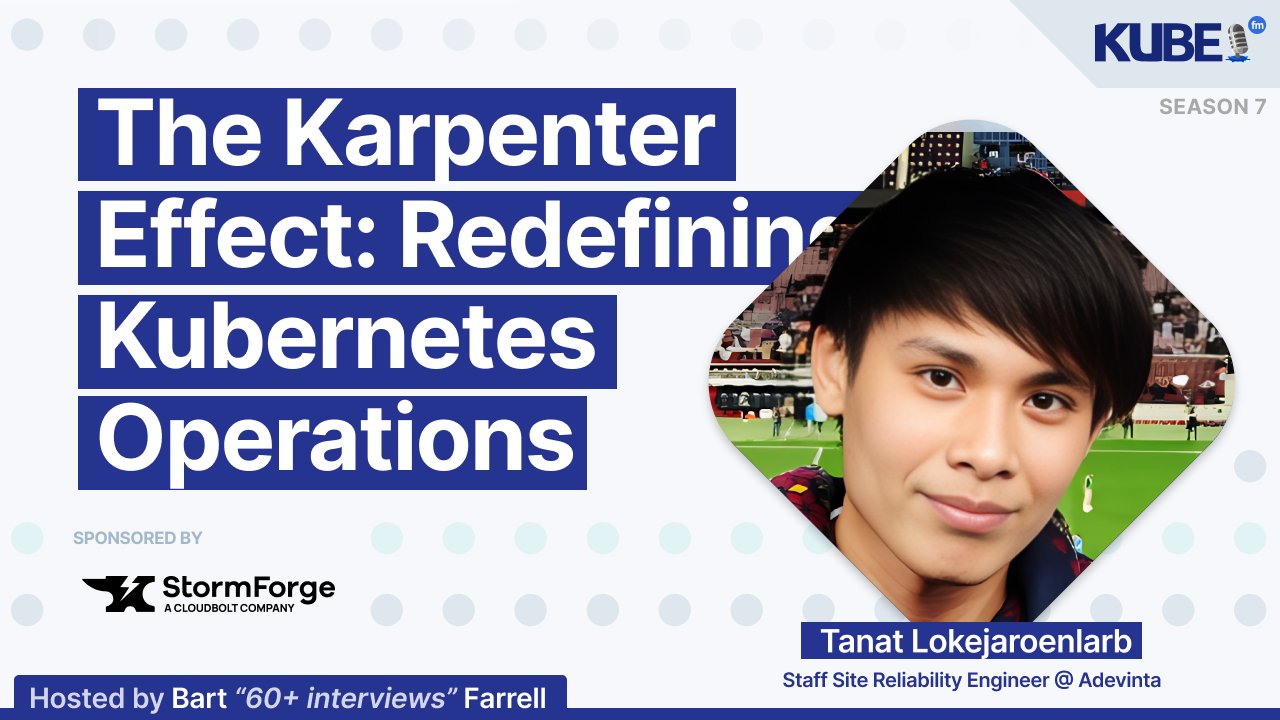
Bart Farrell: Our podcast guest, Tanat, says the observability gain from Karpenter has been huge for their operations. What observability improvements have been most valuable for your Kubernetes operations?
Reza Ramezanpour: Oh, very interesting. So observability is a big thing. It's a big trend right now. And it's been like this for a couple of years now. I guess when we are talking about observability, though, we need to be very mindful of what is it that we are talking about. There was a really great book about observability and it talked about three pillars that you have. It's like logs, it's metrics, it's application profiling, those sort of performance things. So it really is important to know who is your audience and what sort of logs or observability materials you're making available for them to prevent some sort of alert fatigue or observability fatigue. Now, that being said, for me, the most important thing that I found was application profiling with eBPF. Why do I feel like that was the most important? Because I'm a reverse engineer. I do like to learn what is happening inside my applications that I'm deploying. Most of the time when you have an application, it shows you, for instance, I tried to talk from pod A to pod B or some ingress is coming and going somewhere, but you don't have the full picture. And the full picture is after your application received that packet or when it wanted to send a packet, what was actually happening inside the application. What were the hooks? What were the syscalls? What were the functions they called? Was there a memory leak? Wasn't there a memory leak? So before eBPF application profiling, you had to run some sort of debug, which has a very big cost. You needed to, for instance, if you were like me, you would run a debugger inside a pod. Again, huge toll, a lot of disadvantages in terms of having that performance hits, but you would get an inside look into the inner working of your applications. Now with eBPF, everything that I talked about is basically done in a kernel level, while stuff that are happening, you will be the observer and you go like, all right, I want to know if my application is trying to access this part of the kernel, that part of the kernel. This is something that a lot of projects right now are embedding in their solutions, open source or paid. For instance, Calico Cloud for free shows you a lot of like layer seven stuff that are taken with these eBPF instruments. There are a lot of other open source in this area. For instance, Pyroscope was the first thing that I used in order to send eBPF probe into my Kubernetes cluster and gain that information and have it in Grafana. Again, it all depends on what you're trying to achieve. But when you see the whole picture, it actually resonates with a better sort of understanding what is happening inside your cluster.
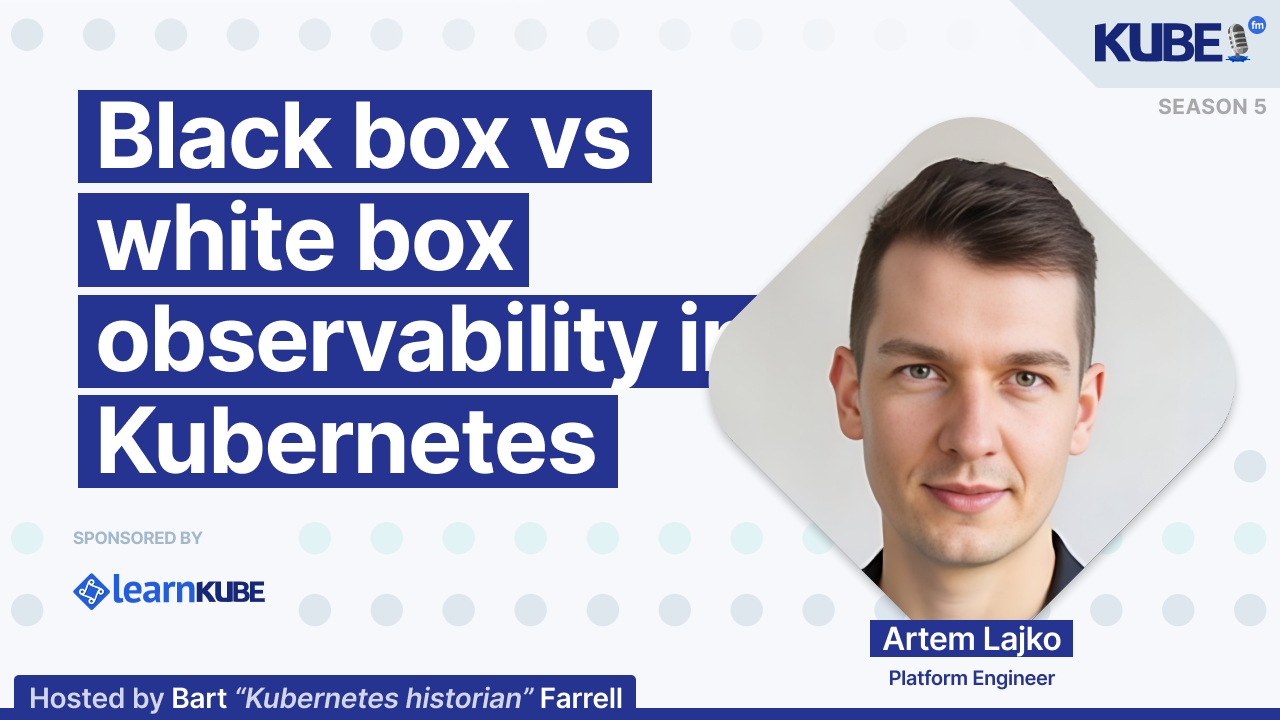
Bart Farrell: Our guest Artem stated, the worst thing is when you roll out the entire monitoring stack and nobody uses it, wasting many resources and money. How do you ensure monitoring tools are used in your organization?
Reza Ramezanpour: It is true. And it's mostly because of fatigue. Monitoring and observability provides a lot of information. These sort of information are usually very interesting in the first 10 seconds. You see a lot of like percentages, a lot of alerts, and you're like, all right, this is working. But imagine every time that somebody connects to your cluster, you would get an alert on your phone. The first 10, you would be like, all right, this is what I want. The former like 100 or 10,000, every person that connects to you, to your cluster, you would get a notification. That would bring fatigue. So what you need to know, what you need to understand is monitoring is not something that would require you to always be mindful. It's there for you to take a load off of your mind. It will gather information for you. It would be your detective. It would gather what is the IOSTAT? What is this? What is that? And depending on performance, depending on the ingestions that it's doing or it's taking, it will give you a better look into your campaigns, your deployments. Basically, you are trying to learn from history and say, all right, if I'm trying to run a campaign, how much money I need to spend on it? How can I get that information from the monitoring tools that I have? So now you get into the waters that, all right, I have a monitoring system. It has some information. I've figured out I can go back and figure out what to do in the future. But is this the only thing that it does? If it is, it's not worth the money. But that is not all. Because when you have some sort of monitoring stack that also does observability, you can actually figure out what is happening in the moment and sort of prevent outages before they occur. One of the most important things that you can go and do right now is most, I would assume right now, because of the open telemetry being this big in Kubernetes and CNCF landscape, right now, every sort of project offers some sort of open telemetry logs or log ingestions. So just have those. Try to have at least like a 24 hours sort of like log retention. Look at the logs before you do any sort of alerts or dashboards or whatever. Figure out what are the most important ingestion points or information points for your use case. From there, create something that is informative and not making you go like, all right, I need to get rid of this monitoring stack because it's just pushing a lot of garbage into my phone or into any sort of medium that I have.
Bart Farrell: Kubernetes turned 10 last year. What should we expect in the next 10 years?
Reza Ramezanpour: The first thing that I expect to see is a lot of job posts that are going to say 20 years of experience with Kubernetes. Other than that, AI is going to be a big thing. A lot of businesses, enterprises are now focusing on AI. And it's sort of funny because if you remember, we are coming from everyone running big servers, chunky servers to run one application. Then we migrated to small VMs for each sort of like application-ish with an OS. And from those... small virtual machines, we went to tiny containers for individual services or microservices. Again, from being a chunky application, a monolithic, going into like smaller, smaller, smaller pieces. And as the saying goes, I guess, history repeats itself. So now, because of AI, we're trying to figure out how we can go from like... tiny containers to bigger containers because containers are sort of like created with this thing in mind that we're going to have a golden image of our application and we're not going to care about the kernel or the OS. Now with the LLMs, with the diffusion models, what we need is two sort of like drivers. We need the, for instance, Python drivers that talks to the gpu and gpu drivers on the Linux server. So these two need to talk to each other and they can be incompatible. So that is a big issue right now that everybody's trying to solve, sort of like moving things around. The other thing is LLMs on their own. They're like very big sort of images where we're gonna store them, how we're gonna store them, if it's distributed, how we're gonna like use them. in some sort of unified way so we are not wasting a lot of storages. So I would assume in the next 10 years, there's going to be a lot of AI talk how we can get best performance for the money that we are spending. And with that, there's a maintainer toll. So a lot of projects are going to stop. You, me, you, everybody who sees this medium needs to sort of get involved, go to the communities, try to offer your help. It's not always about like writing a code. Sometimes, most of the time, it's actually documentation. There's like a lot of things that each project can do, but because the documentation lacks to show it, or we never thought about like writing it in that way, other people cannot find it. And that's sort of... gets in the way of us having a better reach for people. Evangelize the projects that you're using, whatever project that you're using, if it's open source, if it's not open source, if it's solving an issue for you, make sure others know it. So somebody like me can go take a look at it and apply it to their own problems. And the other thing is, This is some sort of like maybe a nitpick for me, but I guess we need to move from being very scalable to a little bit scalable. Let me elaborate on that. So Kubernetes right now is great for the scale of Google's, Microsoft's and those sort of companies. But what if I'm running a very small company? Don't get me wrong, you can still use Kubernetes. It will work, it will run your containers. But the learning curve for me with just like two servers is very big. So that might prevent me from using Kubernetes. So maybe there can be a middle ground, some sort of compromises that makes Kubernetes smaller maybe. allows more people to get involved in running Kubernetes.
Bart Farrell: Reza, what's next for you?
Reza Ramezanpour: Great question. So I either end up doing my stand-up comedy routines more often and get rid of computers altogether or become a chef. It's one of these two.
Bart Farrell: Last but not least, if people want to reach out or let's say maybe get involved in Calico, what's the best way to get in touch with you?
Reza Ramezanpour: All right. So there are a couple of ways. First of all, our Slack channel. slack.projectcalico.org. If you go to that website, you can just get in and you will be greeted by my messages. The other place is GitHub. FrozenProcess is my handle, github.com slash frozenprocess. And my LinkedIn, my Blue Sky, whatever social that is relevant these days will be written there and you can find me there.
Bart Farrell: Thanks. Take care.
Reza Ramezanpour: Thank you. Bye.


