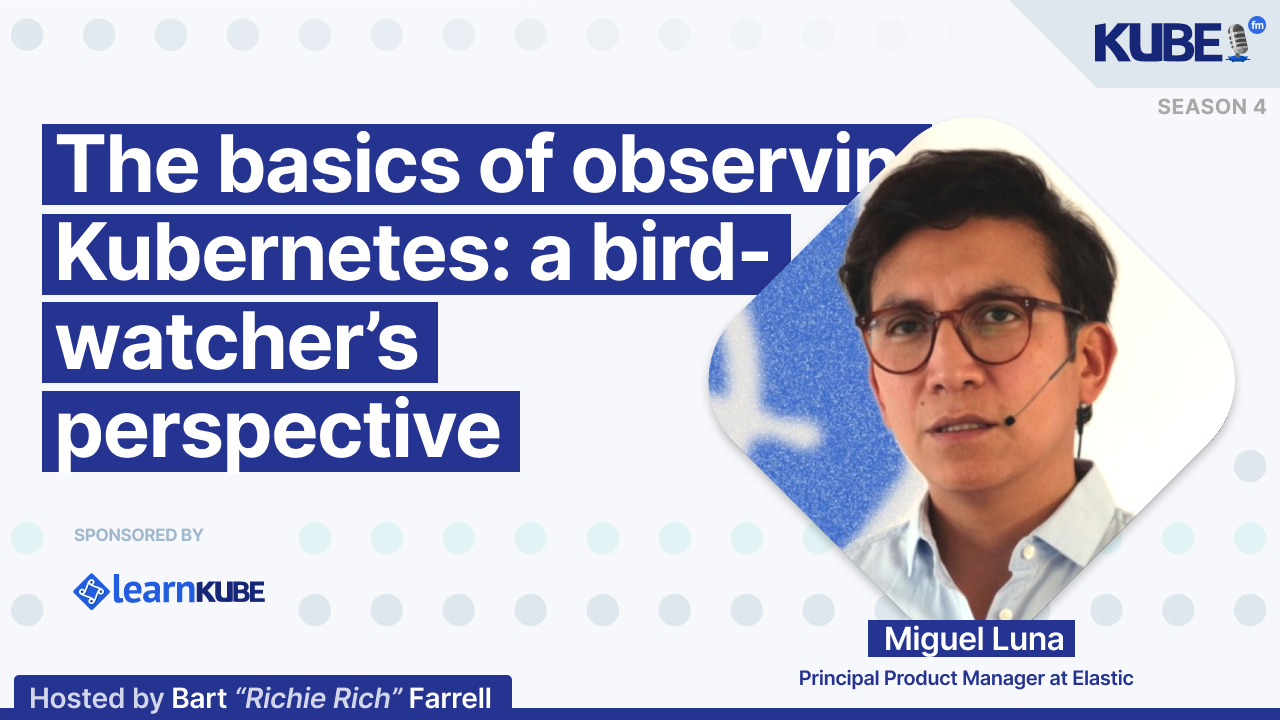
Bart: In this episode of KubeFM, I got a chance to speak to Miguel Luna, who's a Principal Product Manager at Elastic. Miguel and I spoke about Observability in Kubernetes, which helps you gain insights into the system state, as well as formulating new questions based on the observed data. Observability in Kubernetes can be divided into different sections, related to the observation of the application, and in addition, observation of the infrastructure. Metrics, logs, and traces are fundamental to Observability in Kubernetes, as it... is crucial for understanding a system's performance and health. Metrics and traces provide valuable information about the system. Each has its own focus and context. Furthermore, alerts and visualizations are important tools in Observability as they allow identifying issues and understanding the system's health. In this episode of KubeFM, I got a chance to speak to Miguel about these topics, his experience with them, the role that we're seeing of different projects such as Keptn and also... open telemetry in the ecosystem to have a further understanding of where Observability is now and where it will be in the future with the integration of AI technologies. This episode is sponsored by Learnk8s. How do you choose the best instance type for your Kubernetes cluster? Should you use few and very large instances or small and many? When using an 8GB 2V CPU instance, are all the memory and CPU available to pods? Is running the same Kubernetes node in AWS cheaper or more expensive... than Azure and GCP? The Kubernetes Instance Calculator answers those questions and a lot more. The calculator is a free tool that lets you estimate cost for your workloads based on requests and instance sizes, explore instance overcommitment and efficiency, identify over-and underspending by model error rates on your actual memory and CPU usage, compare instances between different cloud providers. It's an easy way to explore cost and efficiency before writing any line of code. You can find the link to the calculator in the comments. Okay, Miguel, welcome to KubeFM. First and foremost, what three emerging Kubernetes tools are you keeping an eye on?
Miguel: So there are three emerging tools that I find particularly exciting right now. First up is K8sGPT, which leverages AI to provide intelligent insights and troubleshooting suggestions for Kubernetes clusters. Next is K9s.
Bart: It's a fantastic CLI tool that transforms the Kubernetes management experience.
Miguel: It plays a terminal UI. This allows for efficient navigation and real-time monitoring of your cluster. And lastly, OpenTelemetry. OpenTelemetry is a game changer for Observability. It provides a vendor-agnostic unified framework for collecting metrics, logs, and traces. One particular thing that I like about OpenTelemetry is its data model. It enables creating a context layer that provides out-of-the-box correlation for all signals.
Bart: I'm sure one of our previous guests, Adriana, who's very active in the OpenTelemetry space, will be very happy to hear that. One question, just because we saw each other previously at KubeCon, and AI was being spoken about a lot since you mentioned K8sGPT in the beginning. In your day-to-day work, do you find yourself using AI a lot? Do you expect to be using it a lot more in the next six months? Where are you at with this whole AI trend?
Miguel: So it's interesting because at some point, the pattern that we'd start to approach, as most people have been approaching, is to just throw things at Gen AI and see what it comes back with. I feel that one thing we've been exploring a lot is what if we can get Gen AI not just to answer questions but also to formulate the questions based on the data it observes. This iterative process will allow the AI to continually refine its understanding and predictions of the data. For example, if the system detects an anomaly, it could automatically generate a series of related questions, answer them, determine the best course of action, and even suggest visualizations. This dynamic approach could not just think about Gen AI as being on the side, waiting for us to ask a question, but more like Gen AI is under the hood, supporting us with its knowledge.
Bart: Love it. Any reference I can get to Clippy is much appreciated. As a 90s kid who grew up in the 90s, I really appreciate that. All right. We did touch a little bit on what you're doing in your day to day. But let's take a step back. What do you do? Who do you work for? What's Miguel all about?
Miguel: All right. So I'm a principal product manager at Elastic. We are the leading search analytics company. I specialize in cloud native Observability. I'm originally from Colombia. I've been in London for 18 years. I came here and the weather, the food, just nothing that you can leave on the table. I just, I love London. So I've been here working and I love tech. So this is mostly a good summary for me.
Bart: And how did you get into cloud native in the first place?
Miguel: So I was working in the telco industry and we had this huge monolith that restricted us to do only fortnightly releases. So imagine like 26 releases per year. This was a huge blocker for any fast iteration on any lean techniques. And what we did is we took... with engineering we got a very great proposal and we took a two-year shift where we said, "Hey, let's freeze all feature building, pause all feature building, and let's focus on getting continuous delivery out of the door." So we set up a proper CI/CD with test delivery, the whole package. During these projects, I was first exposed to Kubernetes. By the time I left that company, we were doing like 3,000 releases per year, which is crazy. Any change could immediately... So basically, things like GitOps were implemented. Later, I joined Pivotal, which was shifting its focus from Cloud Foundry to Kubernetes. As a product manager, one of my first challenges was to understand this Kubernetes thing deeply. I began by writing an article. I put myself a challenge where I needed to write an article and give a talk. This journey led me to write an article that explained Kubernetes as a cookie shop. I think if you Google my name and like cookies and Kubernetes, you'll probably find it. I even ended up speaking at KubeCon five years ago. So this marked my official dive into the cloud native world.
Bart: Now it's no secret that the cloud native and Kubernetes worlds move very, very quickly. How do you stay up to date with all the changes that are going on? What are your go-to resources?
Miguel: I like to stay updated through a mix of newsletters, podcasts like this one, and community events. I find newsletters and podcasts very useful for the expertise that they bring, especially on topics that are currently relevant. Additionally, when I attend events like KubeCon, I make it a point to visit the smaller booths because it's fascinating to see the innovative work. The work being done by startups in the space is sometimes mind-blowing. It often provides a glimpse of what is going to come in the future.
Bart: If you could go back and give yourself one piece of career advice when you got started, what would that be?
Miguel: I wish I could. Honestly, I think it would be about embracing continuous learning. The tech landscape changes rapidly. It's all about staying curious and adaptable. This is key. It doesn't mean that if you switch off for six months, then when you come back, you lost it. The story is more about always having eagerness to seek out new knowledge and skills, even if they seem to be outside of your immediate job scope.
Bart: Good. Now, as part of our monthly content discovery, we found this article, The Basics of Observing Kubernetes, A Birdwatcher's Perspective, based on your experience with a real instance. So we're going to take a look at this a little bit more in detail. Now, most listeners might link the idea of Observability with Prometheus and Grafana. Of course, Observability is much larger than that. But how do you explain it to those who still don't know?
Miguel: Great way to begin the meaty part. This question can take all the time. I'll give you a short answer. It's crucial to understand that Observability is not the same as monitoring. Monitoring is all about collecting predefined sets of metrics and logs to track the health of our system. It's often about setting up alerts for known issues and thresholds. Monitoring is essential, but it deals with known unknowns, the problems that we anticipate. Observability, on the other hand, is about gaining insights into the system's behavior, including unknown unknowns. We need to get a more holistic view, allowing us to ask new questions. Get answers about the system state and performance, adapt, and even reach a point where we understand answers to questions that we didn't even know we needed to ask. You mentioned Prometheus. Prometheus only gives you metrics, which tell you something is wrong, but to understand why, you need logs, and to understand where, you need traces. The closer we get to forming this comprehensive Observability view is by collecting these signals, commonly referred to as the three pillars. We need to tie them together. On their own, they give you part of the story, but they're not good enough. We even have a fourth signal coming up, which is profiling. Actually, at Elastic, the company I work with, we recently donated the universal profiling agent to OpenTelemetry, and we are working on making this signal vendor-agnostic and part of this comprehensive Observability view that we need to have.
Bart: So if we take that definition and move it into the Kubernetes context, how does somebody go about observing a Kubernetes cluster? Where do they begin? Is it with apps, nodes, physical machines, control planes? I imagine there are a lot of different things that have to be taken into consideration when we're thinking about monitoring, or as you said, much further, Observability.
Miguel: Indeed, there are many layers to Kubernetes. What I like to do with Kubernetes is approach it in two ways. First, I love system thinking, so that's the perspective I like to take, which is similar to the diverse Observability article you mentioned, where everything works together harmoniously. In system thinking, this is called a holistic view. We focus on the function of the system. You simplify and think, why do you have Kubernetes? The answer typically is to run containerized applications in a reliable fashion. But how do you define reliable? Let's consider an example of an application running. For instance, someone presses a button on their phone to play a song on Spotify. There needs to be a server ready on the other side to handle that streaming. Kubernetes might be behind it. Now let's say a group of users starts streaming at the same time, and you want to make sure you service those users in the way they expect. That's to ensure they are getting what they're paying for, which is the ability to stream. So we start monitoring service level objectives (SLOs). When you start getting errors or issues, you start seeing things like running over your error budget, so things start spiking. You don't want to let it get to the point where things go wrong. You want to know that you are heading in that direction. It's important to understand and start with monitoring SLOs. Further below, you need to understand what is impacting the SLOs. It could be that everything is pointing to a specific service producing these errors. If you keep going down, this service might depend on some pods from a particular deployment located on a specific node. Let's say this node is getting all the files from a specific hard drive, and that hard drive happens to be performing a backup at the same time you're getting the errors. We come to the realization that everything on its own is working okay because the database wasn't having any errors, but your users were. The node wasn't having any errors. With this holistic approach, we realize that you have competing traffic impacting reliability. As a result, we can schedule the backups at a time when fewer users are streaming, achieving more reliability, which is what we wanted. You see that I began with the higher why and then found the root cause. The second aspect of my approach is I like to define the boundaries of the system based on roles. This is where I like to split Kubernetes into what I call the application and infrastructure layers. I'm sure plenty of folks have their own names or similar definitions. I have an image that I can share. The application layer is mostly cluster users deploying their applications in Kubernetes. They are interested in things like services, pods, and worker resources, which are the objects Kubernetes uses to get the pods deployed. You want to observe your deployments, daemonsets, and replica sets. If something goes wrong, these cluster users might want a sneak peek or at least a high-level view of where these pods are running, but they probably don't want to start ingesting all data about the nodes or control plane. This could be a good boundary to set. On the other side, we find the infrastructure layers, where you have the nodes, control plane, and all these components. If you're a cluster admin, you think, okay, there is a problem. One of my cluster users is complaining about a specific node because there are some key indicators. Let me investigate and understand. I might also want some information about what's happening on the application layer itself. For example, a cluster user complains, and I can see that the node is indeed struggling. I can find out that another application is being resource-hungry. I find that it's from cluster user B, and I talk to them to understand why this is happening. In larger companies, the infrastructure can be provided as a service, and there are dedicated teams. This overlap helps folks understand where their things are running without necessarily going beyond key indicators. They need to provide context because it's not just about applications not doing well; it's about applications not doing well specifically on this node. This narrows the investigation scope. Assuming someone's using a Kubernetes managed service like EKS, GKE, or AKS, some of the infrastructure is abstracted away from them.
Bart: They're still in charge of monitoring Kubernetes nodes, for example. What component should they observe and how granular should they go?
Miguel: So this is a... I happen to have another diagram for this.
Bart: Go for it.
Miguel: So this is an interesting one. I think most of us think of managed services as something binary. Either you're managed or you're not managed or self-managed, but there is a spectrum to it and it's quite important to understand. In this diagram, for those listening to the podcast, I have the application layer on top and the infrastructure layer at the bottom. I've divided it into what is DIY, where you manage everything, and what is more managed, where you probably don't manage the control plane and might manage the nodes. Back to the example you gave, if you're using EKS or AKS, you're probably not managing the control plane. You might want to observe it. The challenge here is that sometimes providers make decisions on what data they allow you to ingest or give you access to. There is another model that fits here. GKE has this autopilot mode, which means you don't even have to worry about the infrastructure layer; the nodes will be scaled up and down automatically. It doesn't mean you can completely forget about it because you need to understand what is going on, especially if there are issues. You need that overlap, that handshake, where you provide context to the team managing it because, at the end of the day, it's being managed by someone or something on the other end. You need to provide that context if issues arise.
Bart: If someone hosts their cluster on bare metal, I imagine they'll also have to look after the rest of the control plane.
Miguel: Very interesting. This gets more interesting. Yup. With bare metal, you need to expand your observability downwards. When I say downwards, it's further down the stack, into the physical hardware. It's not just about observing nodes, which could be virtual machines. You need to understand the underlying physical infrastructure because everything is on you. If a hard disk fails, you have to go... down to your servers to swap it out. If a CPU is overheating, you need to monitor the temperature of the room or even each server. This adds another layer of complexity to your server strategy. One thing I have seen recently in a few conversations is the growing concern about the rising cost of cloud services. It's the same thing. It's not a binary decision. It's not like, is it cheaper or more expensive? It's all about your specific context and needs. Sometimes it can be cheaper to run your own data center, and sometimes a managed model works best. The key is to balance the cost and benefit based on your particular situation.
Bart: Got it. With all those metrics coming in from the infrastructure, Kubernetes itself, and the running applications, I imagine there can be a fair amount of things to look into. How does somebody know what kind of metrics are available to them?
Miguel: That's a very good question. There is a lot of information out there, but it can be overwhelming. I like to frame it in the context of the three pillars of Observability. Metrics, logs, and traces. Metrics tell you what is wrong. For Kubernetes, you can get metrics from lots of pods and the control plane components. Key metrics like pressure and latency errors will help you understand the basics. On the logs side, logs will help us understand what is wrong by providing context. In Kubernetes, we can gather logs from the control plane, the pods, or even the hosts emitting the application logs. We can also have audit logs, which can overlap with security use cases. Finally, traces represent the interaction between the different components, helping us understand where the problems are arising. To summarize, to start with Kubernetes, I would look at the basics: node metrics, things like CPU, memory, disk usage, and network I/O. Pod and workload object metrics, such as port and container resource usage. Also, replica availability in the case of workload objects. Control plane metrics, health, and performance of the Kubernetes components. Depending on your use case, you might be more interested in one or the other. For example, if you have a highly available etcd.
Bart: You don't want to be keeping a close eye on your single etcd, but if you only have one, you might, which is not recommended. You might want to have a closer look at that. Application metrics are relevant depending on the application you have running. Of the three pillars, logging is probably the most used and understood. Most companies and engineers might focus only on this, and the rest could be considered nice to have. They might sprinkle some Prometheus on top, and that's mostly it. Is that the right way to go, or would you say they're missing out on something?
Miguel: I have one opinion that is not controversial on this topic. So I'll give my controversy or not. I think they do have a valid point. If you know something is wrong through metrics and you can identify where the problems occur using traces, then logging can be very effective on its own. Logs provide you with the detailed context needed to diagnose and understand where the root cause can be. However, the challenge comes when you go into more complex systems where correlating all these signals becomes more challenging. At the end of the day, the real power of Observability comes from the ability to correlate these signals. I think this is where projects like OpenTelemetry shine. With OpenTelemetry, you can get a unified enrichment of these signals, enabling you to keep a holistic view of your system and not just think about one or the other.
Bart: So if all these metrics, traces, and logs are collected and stored somewhere, what's next? At that point, is it safe to say that someone's doing Observability right?
Miguel: Getting the data in properly is hard, but this is just the beginning. In fact, if you don't extract value from this data, then it's all for nothing. The next crucial steps are introducing things like alerting and visualization. With alerting, you ensure that you are immediately aware of critical issues that need your attention. You need to set up meaningful alerts, but it's not just about setting up an alert on a metric that goes, "the threshold has been reached." You need to include more context. This is where you need to be able to correlate with your signal. If you include logs that can help you understand why that threshold was breached or why this is happening, then the alert will be more effective. Many times the alert is going to end up in the hands of someone that has probably a very one-sided view of your system and they don't have all the context. It may be an SRE that is running the application, but the applications are written by a team that is not on call at the time. If you are able to provide that person with good context, you are setting them up for success. The other aspect I touched on was visualizations. I find that visualizations help you consume and make sense of vast amounts of data. Tools like dashboards allow you to see trends, identify anomalies, and understand the overall health of your system at a glance. We are visual people. I read a book about being visual, which talks about 75% of our neurons being visual. When we are dealing in a world of big data, the more visual you can make your data, the more likely you are to spot things that otherwise you wouldn't be able to.
Bart: With the idea of data, being able to see things. A big part of Observability that we hear about a lot is alerting. But in order for engineers not to be overwhelmed by alerts, how do you decide that something is important enough to alert on? Is there a standard set of alerts that you recommend using, or does it depend on more specifics?
Miguel: So let me start with saying this. The most effective alerting strategy is tailored to your specific use case. Standard alerts that include things like CPU usage, memory pressure, and disk space running low are fundamental and can indicate serious issues. Beyond the basics, it's essential to consider alerts that are specific to your environment and what you want to achieve with it. For instance, CPU thresholds might be different for a container hosting an application that, if it went down, would cause a company to lose millions. It's not the same for... the same company having another container that is running some background calculation. The alerts are going to be different. I wouldn't just go and set up an out-of-the-box CPU alert that at one point would be at 90% and another at 50%. Without the context of why, it's very difficult to set something that is effective. There are a few tips I can share. First, start with why. Understand your... SLAs and SLOs because this will guide you into which metrics are critical to monitor and alert. Set the basics; there are things that we know if they go wrong, we're not going to have a good time. Implement standard alerts for CPU, memory, and disk usage because this will help us catch common issues. Analyze past incidents; this is key. I learned this from an SRE who told me they look at past incidents and set up alerts that would help catch them if they were to happen again. They said it has been effective. This is like Pareto; sometimes 20% of the causes get 80% of the results. If you catch 20% of these, you'll have a better life. Finally, iterate and improve. Regularly review the alerts, especially to remove the ones that are no longer useful. You don't want to reach a point where you have alert fatigue. Add new ones as needed. Keep it as a regular thing to iterate and improve on the alerts.
Bart: There's something else about Kubernetes that Viktor Farcic always complains about, and that's Kubernetes Events. What are Kubernetes Events and are they useful for making sense of what's going on in your cluster?
Miguel: So I like to think of Kubernetes Events as structured logs. These logs capture significant actions and state changes within your cluster. For instance, an event log might tell us when a pod is scheduled on a node, when it starts running, if it fails, or when it's terminated. Each of these events includes a timestamp, the time of the event, the reason, and a measure describing the occurrence. This is why I see them as structured logs. Viktor also argues that Kubernetes Events should be easier for non-professionals to digest.
Bart: Events should bubble up to the resources that created them. For example, if a pod is deleted, those events will be propagated to the deployment object. When troubleshooting deployments, an engineer could list all the events on the deployments and identify the root cause. This is a bold and interesting idea. Does ingesting Kubernetes Events, visualizing, and alerting on them help engineers with that? Is Viktor right?
Miguel: So I think Viktor has a point that, while these events are incredibly useful for troubleshooting and understanding state, there is a challenge when it comes to correlating events with all the dependent resources. The challenge is that Kubernetes Events don't inherently correlate all the dependencies out of the box. They provide raw data, but not the contextual connections between the different components. I find that this lack of correlation can make it difficult to trace the root cause. However, this leads to an important balance that I feel needs to be struck. Where do we set the line between Kubernetes focusing on its primary function, which is managing containerized applications, and providing built-in self-observability features? One of the main things that people like about Kubernetes is how robust it is as an orchestration tool. The core function is to manage the deployment, scaling, and operation of these containers. Adding too many built-in observability features could complicate its primary purpose and increase its complexity. But I think there is a need for basic self-observability, which I think is what events are trying to do. In my opinion, the solution lies in developing decoupled Kubernetes correlation components that would enable this observability without adding complexity to what is already a complex system. I see here, and this is the third time I quote OpenTelemetry, there is a big opportunity for closer integration of OpenTelemetry with Kubernetes to capture key information like the relationship between Kubernetes resources and understandings without Kubernetes itself having to carry the burden of doing that. So it can remain focused on its core functionalities, and we can have OpenTelemetry taking care of that. I think Viktor is right about the user needs, but I'm not quite sure that I agree about the implementation being part of Kubernetes itself.
Bart: I think if there's one takeaway from this discussion, it is that there is definitely a lot to learn regarding Observability. Do you think this is due to it perhaps being something that's only recently taken off? On top of that, where do you see it going in the next three to five years?
Miguel: So definitely. That's a great point. I think Observability has gained significant attention recently, especially because we have only recently started to align on the philosophical definitions of what Observability truly is. I think that there's still some way to go. Some people might even challenge the definition that I gave or even improve it. But I think that we are at least getting to some level of alignment. I know that about. Where is it going next? I know it's a bit of a template answer these days, but I truly believe this one. In the next two to three, maybe five years, I expect Observability to evolve significantly with the integration of generative AI or AI in general. Generative AI can analyze vast amounts of Observability data, identify patterns, and operationalize a lot of the data that today is in people's brains. As a result, people will become more proactive, and teams can focus more on improving their systems rather than reacting to issues. They'll have all the information at their fingertips. You no longer need to become a Q&A expert. No one should have to become a Q&A expert to use Kubernetes. I'd like to give an example. In transportation, if I need to get from A to B, I can take three approaches. One is to drive a car but also be the mechanic if something breaks, which is like full DIY Kubernetes. The managed Kubernetes approach is where I drive the car, but if something fails, I have a mechanic on my payroll. The last one is where everything is managed, and I just take over. I don't need to worry about cars or things going wrong. If anything goes wrong, it's not my problem. This is where I see things going.
Bart: I like the analogy. One thing, as we wrap up. We noticed on your bio that you do something called visual thinking. For people out there who don't know what it is, how do you explain it and how does it help you do your job?
Miguel: Good catch man. So I was knee deep in Kubernetes documentation a few years ago, trying to make sense of the complexity—pod, node, resource definition, objects. Is it an object? Is it a live thing? Is it just a definition? etc. At one point, I decided to take a break. I ended up wandering through a local bookstore, thinking maybe a change of scenery might help clear my mind. My eyes landed on this bright, colorful book titled "Visual Thinking," which I actually have here. You see, it's this one here. For those watching the podcast, it's from a Dutch agency. It's called, I don't know if the pronunciation is correct, but it's Willemien Brand. It's like Will as in Will and Me and Brand. The book was filled with drawings, diagrams, and charts, which was the opposite of the dense text I had been drowning in. It caught my attention. Visual thinking is the practice of using visuals to process, understand, and communicate information. As I was saying before, our brains are wired to understand and retain visual information more effectively than words alone. The idea resonated with me, and maybe this was the key to unlocking the mysteries of Kubernetes. I started putting it into practice and found that it helped me. I had level conversations with engineers and began sketching some of the Kubernetes concepts. They would reply, saying, "No, it's not this way; it's this other way." Eventually, I found that I was understanding more than when I was just reading the text. It turned out to be a breakthrough, not only for Kubernetes but also for dealing with other complex tasks in my job. In addition to this, I'm an OKR coach.
Bart: What's that about?
Miguel: I'm not a coach.
Bart: Lastly, if people want to get in touch with you, what's the best way to do it?
Miguel: A lot to hear from people, especially anyone listening to this podcast. You can find me on LinkedIn. Just look up my name, Miguel Luna. Funnily enough, you always find that there are a few people that have your same surname. You never thought that for my name, you have 10 or 15 Miguel Lunas, but I think I have a little Kubernetes logo next to mine. That will help, so feel free to connect. Also, if you're attending KubeCon, definitely drop me a message. I'm probably going to be there, and I'd love to meet up in person and say hi. Very good. I can vouch for it that it's definitely worth meeting up and saying hi in person, as we met in the previous KubeCon. I'll definitely see you in the next one, Miguel. Really appreciate your time today and looking forward to the next steps, hearing more about how GenAI is intersecting with Observability. Thank you very much, Bart, and thank you for having me.
Bart: Pleasure.
Miguel: Take care.

