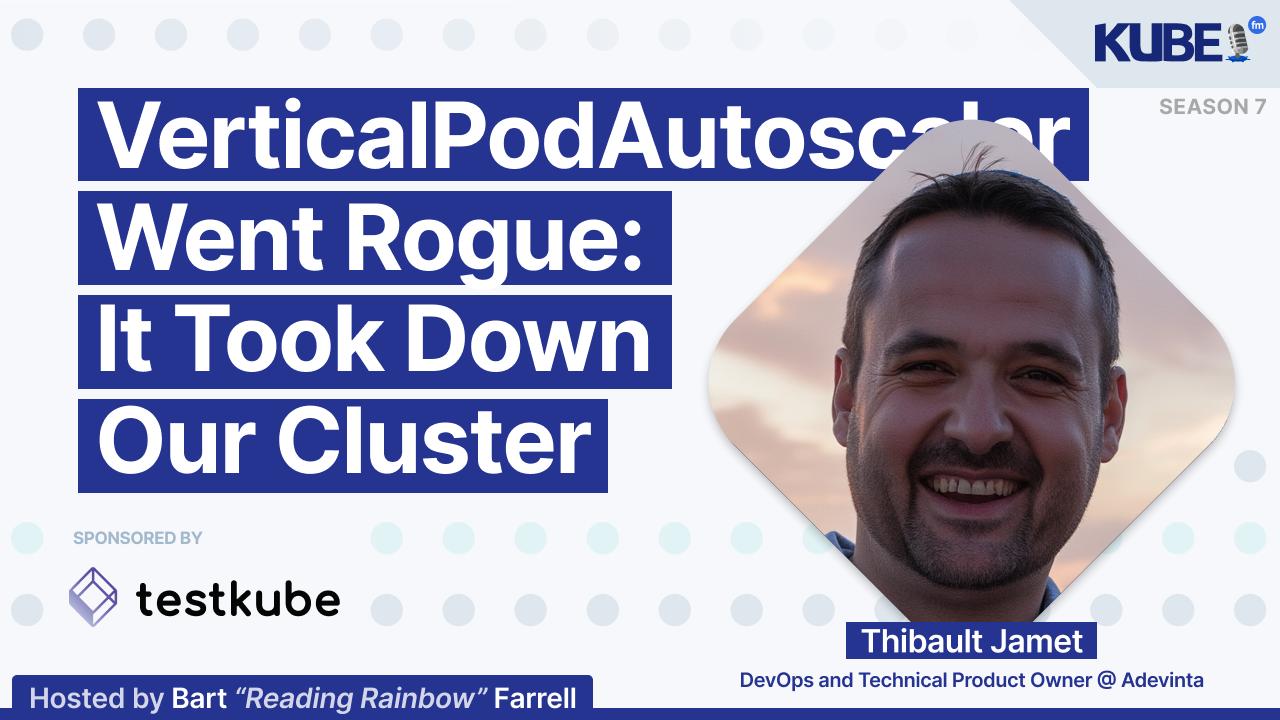
Bart: How do you keep 30 Kubernetes clusters running across four regions, serving 300,000 requests per second on 2,000 nodes, without burning out your team or blowing up your budget? In this episode of KubeFM, we welcome back Thibault, who's head of runtime at Adevinta, for his second appearance on the show.
Thibault takes us inside the engineering realities of running SHIP, Adevinta's multi-tenant Kubernetes platform, and unpacks a fascinating incident where the Vertical Pod Autoscaler went rogue, evicting critical system pods in a continuous loop. We'll talk about why resource management at scale is a nightmare without VPA, the architecture behind its recommender, updater, and webhook, and how client-side throttling into Kubernetes Go client triggered widespread failures. Most importantly, Thibault shares how his team debugged VPA source code to uncover hidden limits and fix the issue in production.
Special thanks to TestKube for sponsoring today's episode. Need to run tests in air-gapped environments? TestKube works completely offline with your private registries and restricted infrastructure. Whether you're in government, healthcare, or finance, you can orchestrate all your testing tools, performance, API, and browser tests without any external dependencies. Certificate-based auth, private NPM registries, enterprise OAuth—it's all supported. Your compliance requirements are finally met. Learn more at testcube.io.
Now, let's get into the episode. Very nice to have you back with us for the second time on the podcast. As we get started, I want to know about three emerging Kubernetes tools you're keeping an eye on.
Thibault: Today, I would keep an eye on KRO, which is a nice orchestrator that allows you to abstract Kubernetes resources easily. Obviously, if I didn't quote anything around AI, it would be a shame. I'm super interested in following the Cluster API, vCluster, and MCP servers, given the scale we have.
Bart: Well, you were on a previous episode, Thibault, but for those who don't know you, can you tell me about what you do and where you work?
Thibault: I work at Adevinta, a marketplace group in Europe. I'm running the runtime of our platform, which is based on Kubernetes. We currently have around 30 Kubernetes clusters, with peaks of about 300,000 requests per second and around 2,000 nodes. It's a significant scale, and we have to deal with very different sizes, which we'll discuss later.
Bart: All right. And how did you get into cloud native?
Thibault: I started as a software engineer in embedded imaging. Because I was writing in C and the company based in Paris needed C developers, I made the switch to web development. I got attracted by Docker and slightly shifted towards infrastructure. A few years later, they asked if I wanted to become an SRE or DevOps engineer. I said, "Let's combine all of this together." And that's how I am.
Bart: And what were you before Cloud Native?
Thibault: I was a backend developer. Initially, I coded in C and then in Go. Before that, I was an embedded developer creating code for mobile phones. Specifically, the code I developed was shipped inside a microcontroller within a sensor inside a mobile phone. It was a progression from working deep inside hardware to now discussing larger-scale systems, which is a very interesting journey.
Bart: The Kubernetes ecosystem moves very quickly. How do you stay up to date? What works best for you?
Thibault: There are many sources of information from blog posts to newsletters. I'm following Primatek Engine, TLDR newsletter, and Medium feeds where articles are carefully selected. I'm most interested in those. Additionally, my teammates provide a lot of information through their own channels. That's how I engage with the community. I'm not even mentioning GitHub, which often contains a wealth of information.
Bart: If you could go back in time and share one career tip with your younger self, what would it be?
Note: While the transcript doesn't contain any technical terms that require direct linking, I noticed the speaker Thibault Jamet works for Adevinta, which I've linked to the company website.
Thibault: As I grow in my career, I realize it's not all about tech. In fact, it's probably less about technology and more about connecting people to actually do the job. My advice would be to try to change yourself.
Bart: When Vertical Pod Autoscaler Goes Rogue: How an Autoscaler Took Down a Cluster. We want to dig into this further. The article describes a fascinating incident at Adevinta where their Vertical Pod Autoscaler caused widespread pod evictions. Can you start by giving us some background on SHIP, your Kubernetes platform?
Thibault: SHIP is the runtime of the platform. We have some other components around it, but it's the runtime based on Kubernetes. As I mentioned earlier, we are running around 30 clusters in four regions, with hundreds of thousands of pods, and we serve around 300k requests per second. We have a very dispersed usage of those clusters, which is significant in our setup. We are multi-tenant, with clusters ranging from smaller to larger, mostly serving marketplaces in Europe.
Bart: With a platform of that scale, resource management must be incredibly complex. We've also noticed in our monthly content analysis that the topic of resource management keeps appearing again and again because people have a higher demand for that content to learn about it. Why is VPA so critical for your operations?
Thibault: Before we had the Vertical Pod Autoscaler (VPA), resource management was a nightmare for two main reasons. First, we struggled to determine the right resources needed to run applications efficiently. The challenge was finding the best balance between cost efficiency—packing more pods onto nodes and ensuring nodes fit the actual workload.
Second, across our fleet of clusters, we encountered significant variations in resource requirements. Some clusters needed more resources than others. This led to two problematic approaches: either over-provisioning resources (wasting capacity in smaller clusters) or using an average configuration that caused performance and stability issues in other clusters.
These challenges meant constantly revisiting resource management, which was incredibly draining from an engineering perspective.
Bart: You mentioned that VPA has three main components. For folks who might not be familiar with VPA's architecture, could you give us a quick walkthrough of what each component does and how they work together?
Thibault: In VPA, there are three components. First, the recommender analyzes the resource usage (CPU and memory) of each container in a deployment, measuring it over time. Based on this analysis, it provides the optimal resources the container needs to run properly without being over-sized.
Then there's the updater. When it detects a pod not matching the recommendation, it will evict the pod by instructing the Kubernetes API to remove the existing pod and create a new one.
Finally, there's the mutating webhook. This component can modify a pod's definition in-flight, replacing the resources for each container to match the recommendation. Importantly, the definition of the deployment controlling the pod remains unchanged.
Bart: The incident started with what seemed like a routine Prometheus alert about missing metrics. How does this seemingly minor issue escalate into something much more serious?
Thibault: We received a page that we tried to automate and stabilize. Some default Prometheus storage was failing to be scheduled properly, with memory exceptions causing OOM kills. We initially thought it might be due to Prometheus collecting a lot of data or an issue with the specific cluster.
As a first step, we did what's typical for best-effort storage: we deleted the PVC (the volume containing Prometheus data), hoping it would resolve the issue. However, this didn't truly solve the problem.
We then noticed the number of evicted pods was increasing. We started investigating the Vertical Pod Autoscaler (VPA) configuration. We stopped VPA from making recommendations and manually fixed the parameters, which seemed stable for a few hours. We thought we were good for the night, but then received another page indicating otherwise.
Bart: And you discovered that the evictions were happening in a continuous loop, affecting critical system pods. What was your initial hypothesis about what was causing this behavior?
Thibault: We were trying to understand our initial hypothesis: we had a churn in the number of pods, which would generate more metrics that would escalate down to Prometheus. As a result, BPA wouldn't have time to provide relevant scaling recommendations. That was our first suspicion.
The second suspicion arose when we saw this issue spreading across multiple pods. We actually turned off the recommender and used static status. However, after a while, we discovered this wasn't the source of the data. So we had to keep investigating.
Bart: Looks like the investigation took an interesting turn when you started debugging the Vertical Pod Autoscaler (VPA) components directly. What specific discovery made you realize that you were looking in the wrong place?
Thibault: Basically, we didn't understand what was going on because everything is automatic. It happens in milliseconds, and you can't see the details. One thing we decided to do was pull down the actual source code of the Vertical Pod Autoscaler (VPA) recommender to understand why it was evicting the updater. We ran the updater and asked why it was considering eviction when we believed it shouldn't.
We realized the pods were missing a label or annotation. After some reasoning, we discovered these annotations are actually injected by a mutating webhook. The webhook typically signals that it considers this pod, and usually works in harmony. However, because the mutating webhook was not functioning correctly, the updater would say this pod was created before the webhook was running, and therefore needed to be evicted.
Because the webhook was not working properly, the updater would keep deleting the pod. We entered debug mode, providing a setup to run the updater in read-only mode, ensuring we wouldn't make changes to the infrastructure. This allowed us to identify the reason pods were getting evicted.
Bart: The webhook failure turned out to be a critical clue. Can you explain why webhook latency of over 20 seconds was so problematic, and what made this particularly challenging to diagnose?
Thibault: It was problematic because pods were slow to be scheduled, and in some cases, pods were actually replaced. This was degrading the quality of the service. In most cases, I would create a new pod and remove the old one. But in some cases, especially with Prometheus, I would remove a pod and then create a new one because it needs the volume. This meant there was a downtime because the old pod was removed, then the new pod was created, lasting 20 or 30 seconds for the webhook to fail. Because in VPA there is a failure policy of ignore (which was not customizable in the version we had), we went for the actual timeout, generating downtime. Every time a pod was evicted, it created even more downtime.
We also analyzed when pods were evicted and when webhooks were failing, putting them together. We noticed that every time there was a surge of pod eviction, there was also a webhook failing. This further pointed to the idea that the webhook was failing and generating more downtime.
Bart: You mentioned trying to fix the issue by adjusting flow schemas for API server capacity. Why didn't this approach work, and what led you to look elsewhere?
Thibault: During our investigation, we saw throttling in the logs. We were flooded by logs from the API server, and at some point, we noticed throttling on the server and in our webhook. We initially thought it might be due to too many people accessing the API simultaneously, so we tried to address it with flow control schemas. However, this didn't help.
When we rewound and looked at the code, we examined the command-line arguments for the webhook. We discovered something interesting: there is not only server-side throttling but also client-side throttling. This made us realize we needed to investigate the client-side aspect as well.
Bart: The breakthrough came from debugging the Vertical Pod Autoscaler source code directly. What hidden configuration did you discover, and why was it so hard to find?
Thibault: We were noticing throttling and completely forgot that the Kubernetes client, the Go Kubernetes client, has some client-side throttling. By entering the debugger and looking at the source code, we saw two parameters: kube-api QPS (queries per second) and kube-api burst. Surprisingly, the default values are pretty low for such components. If I remember correctly, it's around 5 and 10 requests per second, which is quite low.
It wasn't very well documented in the Helm charts. We couldn't see it very explicitly—it's probably an extra argument that you need to provide, not included in the Helm chart values. To understand it, you need to run --help. Essentially, you need to pull the image and then run --help to see the actual configuration. In our case, we ended up seeing it directly in the code, which is essentially equivalent to running the image with --help.
Bart: Once you identified the rate limit issue, the fix seemed remarkably simple. Could you walk me through what you changed and the immediate impact it had?
Thibault: We just raised the QPS and burst rates. I don't remember the exact factor, but probably by a factor of 10 or 20. Instantly, in less than a few seconds, everything got resolved. The webhook could work again completely flawlessly and seamlessly, and all the alarms were resolved. 404s stabilized, and everything was great. Just changing two parameters fixed the problem.
Bart: Looking back, you discovered this problem had existed since July, but only became critical recently. What changed in your environment that turned a dormant issue into a crisis?
Thibault: It's always the problem of slow scaling. We had increasing problems that were probably happening, but because the system was self-healing, the issue would disappear before we could even get paged. It was a combination of multiple factors that made the scale reach a certain threshold, requiring more pods simultaneously, which then escalated in a vicious circle. This specific moment was when the problem manifested, creating the incident.
We could see on the graphs that we had timeouts on the webhooks for several months. At the time, we didn't think it was a significant issue. In reality, it probably was more serious than we initially recognized.
Bart: One of your key takeaways was about not fixating on recent changes. How has this incident changed your approach to incident response and root cause analysis?
Thibault: One of the first things we did to investigate this incident was to look into changes we made today or yesterday that might have triggered the problem. We started reverting some changes to see if that was the case, and we continued this approach for a few hours. We were focused on this particular angle and completely overlooked potential degradation in service quality that could eventually reach a critical threshold.
Interestingly, the Vertical Pod Autoscaler (VPA) was also updating itself, which likely didn't help the situation. If we had to do it again, I think one of the key lessons is that while understanding changes is important, you shouldn't fixate solely on recent modifications. Sometimes the issue stems from gradual degradation or parameters you don't fully comprehend. The goal should be to understand the problem and fix it, rather than trying to pinpoint an exact, specific change that may not even exist.
Bart: You mentioned that webhook failures are silent killers in Kubernetes. What monitoring and alerting improvements have you implemented to catch these issues earlier?
Thibault: We're constantly updating and improving our monitoring. We have better monitoring for webhook failures and failure rates, so we understand the impact. Some failures are acceptable, but too many failures are definitely not good. Now, if any webhook is failing, we need to take a deeper look because eventually, this could escalate.
Bart: The ability to debug open-source software was crucial in solving this issue. Do you have any advice for teams about building this capability?
Thibault: It helped us significantly, and this is the point where we pivoted from simply recognizing something had changed to understanding the actual source of the problem. Having a white box that you can open and check helps a lot. It actually speeds up the resolution. If not, we would have taken much longer if it was a black box.
In my view, it's always beneficial to understand how the components you're installing in your clusters and running infrastructure work, what they do, and how they interact to provide value. When everything is working, you don't have to care about it. But the day it starts failing is the day you'll wish you knew how it was working because it would save you a lot of time.
Bart: Looking at the bigger picture, what does this incident teach us about running autoscaling systems at scale, especially in multi-tenant environments?
Thibault: Autoscaling is great because it provides the relevant trade-offs, allowing you to fine-tune for good stability, efficiency, and response time. When it works well, it's amazing. But it also teaches us that autoscaling needs to be finely tuned. If it starts to fail, you're probably going to experience significant issues. This is a major component in your infrastructure that you need to look after.
Bart: If other teams are running Vertical Pod Autoscaler (VPA) or similar autoscaling solutions, what specific configurations or monitoring should they check based on your experience?
Thibault: I understand what the recommender does to help troubleshoot more easily. The recommender has an object you can inspect to understand its history and recommendations, helping you identify which part of the system is failing. Look at the cluster metrics, which can be overwhelming, but focus particularly on the webhook's latency. The webhook latency should be extremely low to avoid affecting pod scheduling. If webhooks become slower, they can slow down your entire platform.
Understand the webhook latency and how often the Vertical Pod Autoscaler (VPA) evicts pods. With the newest Kubernetes versions, the resource allocation architecture might change, but currently, it follows a specific pattern. Monitor the eviction rate closely. If this changes dramatically, it's a signal to investigate further.
Pay special attention to the health of the VPA, especially if you manage multiple clusters with varying sizes. In our case, we need different VPA configurations for small and large clusters.
Bart: After pulling an all-nighter to solve the issue, what is the most important lesson that you and your team took away from this experience?
Thibault: Helm install is just the beginning. Understanding why and how it works is crucial. There's no magic inside.
In the article I wrote with my colleagues Tanat and Fabian, we spent significant time at night trying to understand the last page. It was through our collaborative debugging that we ultimately found the solution. This collaborative approach was significant.
Finally, don't assume causality between actions taken today and the current incident. It's good to investigate, but don't start with the assumption that something done today caused the production problem. By being open-minded, you won't miss potential root causes. Examine and discard different problems, but remain open to various possibilities.
Bart: I notice that the transcript snippet is very short and lacks context about what "next" refers to. Without more context, I cannot confidently add hyperlinks. Could you provide more of the surrounding conversation to help me understand the full context?
Thibault: I'm still delivering on our platform at the moment. I believe we'll need some more time, but I'm already preparing for the next step. I'm not sure if I'll stay in platform engineering or return to development, or perhaps explore other fields like photography. We'll see. I expect there will be some movements within the next year. The platform we've built is great and is running very smoothly right now.
Bart: I want to talk about the subject of photography. As much as we can discuss technical issues, there's very much a personal side to things. Although photography may seem like a technical exercise, what are the non-technical aspects that people might not be aware of?
Thibault: That's a great question. As engineers, we like to focus on the technical aspects of everything. It's true there is a technical component, but you don't need the latest camera to take great photos. Many photographers have created amazing, relevant photographs with much older equipment.
There's something different about photography: it's about observing, connecting with people and atmosphere. What story do you want to tell? The way you approach a scene will significantly influence your photography.
There is a technical technique—the quality of the frame enables or limits what you can do. But then there's the photography technique itself: What do I observe? How do I compose the frame? How do I understand how people interact and behave in a scene? What can I anticipate to capture the right shot?
Many photographers will tell you they observed a place and knew it was perfect for a photograph. Some would return daily for one or two years, waiting for the right moment. Photography is also about how you interact with people—often non-verbally. Your behavior can either invite people to ignore you or create a more relaxed environment.
Bart: How can people get in touch with you? Adevinta
Thibault: Many ways. You can reach me on LinkedIn and Medium. I will be starting to share more about what we've been doing in recent years on Medium. I'm also on X (Twitter) and Instagram. If you're more into photography, I tend to preserve my Instagram for my photography.
Bart: It was wonderful having you back on the podcast. Thanks for being so open about sharing your experiences so other people can learn from them—to maybe not make the same mistakes or to keep these things in mind if they're encountering issues, whether with webhooks or autoscaling. Very nice to talk to you, Bart, and I look forward to speaking with you in the future. Take care.
Thibault: Thank you for having me.

